Housing delivery · July 2026
Huntsville completed 4,813 housing units in 2025. Nearly half were in five reporting tracts.
Certificates of occupancy show where new homes cleared the City's final occupancy gate. They do not show how many were listed, leased, sold, or occupied by year-end.
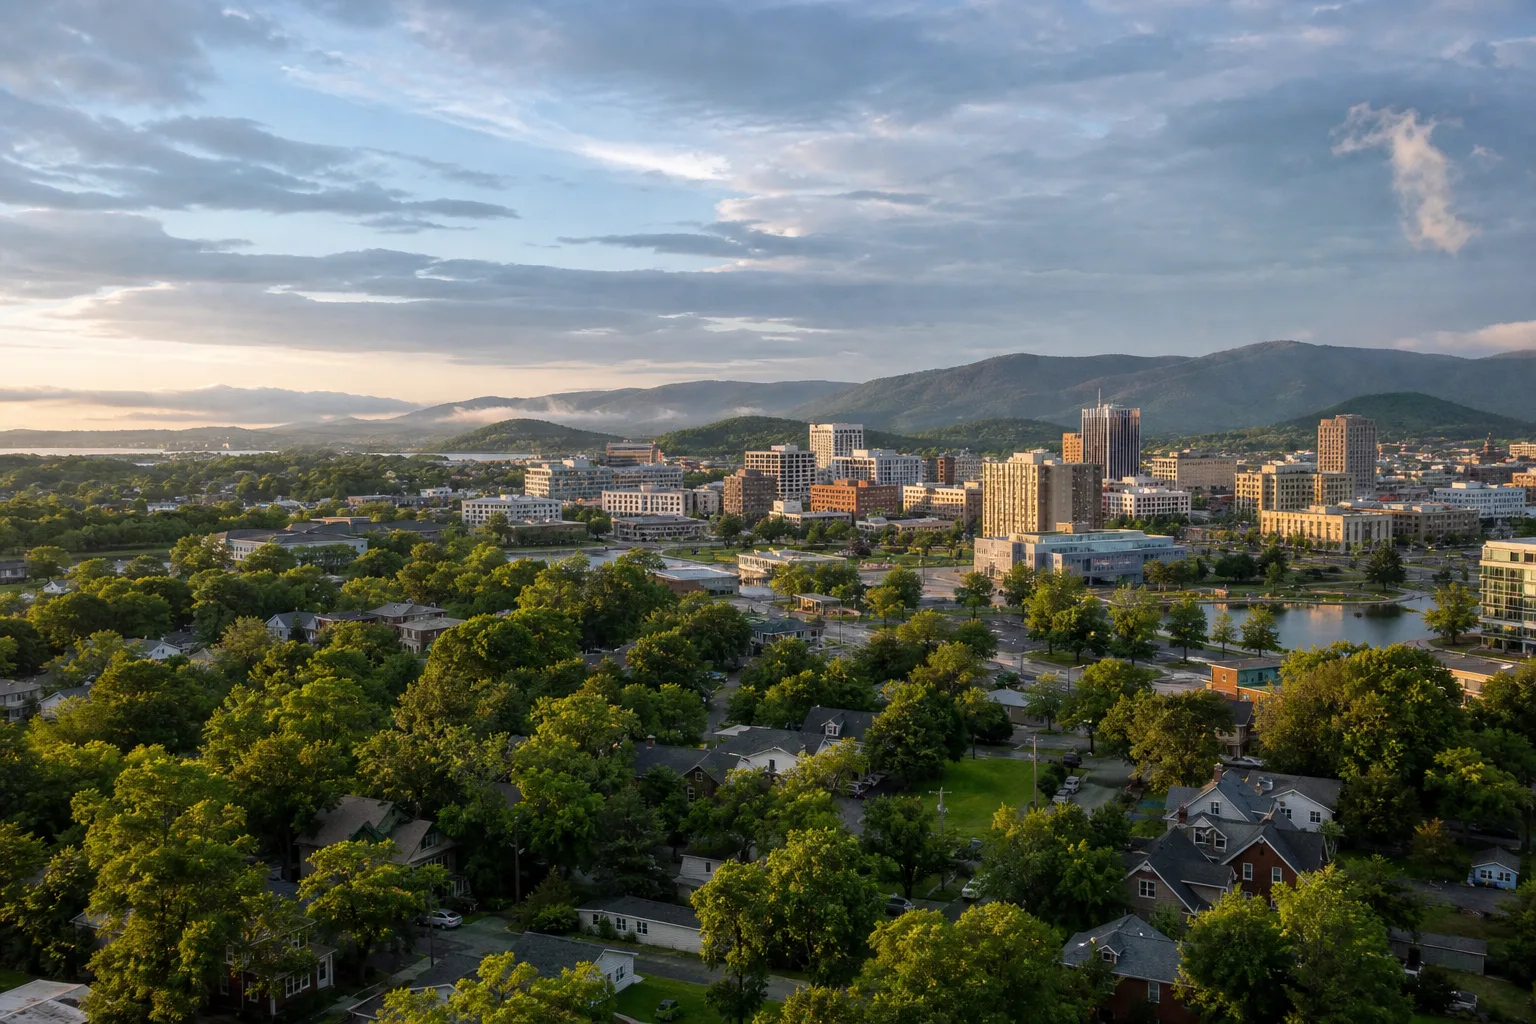
Huntsville issued residential certificates of occupancy for 4,813 newly constructed units during 2025, the second-highest annual total in a City series that begins in 1983. Apartments drove the result: 3,737 units, or 77.6 percent of the citywide total.
Detached homes contributed 935 units and attached single-family townhomes contributed 141. The mix helps explain why a record-sized housing-delivery year did not translate into 4,813 new homes for sale. Most of the completed units were rentals in multifamily buildings.
A certificate of occupancy is a delivery gate
A certificate of occupancy is later-stage evidence than a subdivision approval, site plan, or building permit. It shows that a new unit cleared the City's occupancy process. In the Development Review, “units built” are units granted certificates of occupancy.
The measure is still not the same as market availability. An apartment can receive a certificate before or during lease-up. A newly built house can be owner-occupied, rented, held by a builder, or listed later. The record does not report asking price, rent, concession, buyer, tenant, vacancy, or closing date.
Certificates measure delivered housing. Listings and leases measure how that housing reaches the market.
Geographic concentration
Five reporting tracts delivered 2,307 units
The City supplies area labels for its top five 2020 Census tracts. The housing-type split is reconciled against Table PH-2 of the same report.
| 2020 Census tract and City area label | Detached / townhome | Multifamily | Total new units | Share of city total |
|---|---|---|---|---|
| 14.04Research Park East / MidCity | 0 | 672 | 672 | 14.0% |
| 31Downtown | 2 | 608 | 610 | 12.7% |
| 9.01Chapman | 83 | 293 | 376 | 7.8% |
| 28.01Haysland | 32 | 318 | 350 | 7.3% |
| 106.1272 West | 1 | 298 | 299 | 6.2% |
| Top-five total47.9% of citywide completions | 118 | 2,189 | 2,307 | 47.9% |
The City's “areas included” labels are reporting shorthand. Census tracts are statistical boundaries and may not match a resident's neighborhood name or a development's marketing boundary.
Research Park East led because of MidCity multifamily completions
The Development Review explicitly attributes tract 14.04's first-place total to several multifamily projects completed at MidCity. All 672 newly added units in the tract-level table were multifamily.
That is a clear location-and-type conclusion. The summary source does not assign those 672 units to individual building names. A project-by-project allocation requires permit or certificate records, not a visual guess from the tract map.
Downtown was nearly as concentrated
Downtown tract 31 recorded 610 certificates: 608 multifamily units and two single-family units. Two demolished or moved units left the tract with net growth of 608 homes for the year.
The count should not be assigned to Front Row. The City's year-end apartment table recorded zero Front Row units built as of December 31. Downtown's 608 multifamily additions therefore came from other completed housing, and the aggregate report does not provide a building-by-building allocation on this page.
Chapman and Haysland had more mixed delivery
Chapman tract 9.01 combined 293 multifamily units with 83 single-family units. Haysland tract 28.01 combined 318 multifamily units with 32 single-family units. These were not purely apartment-completion stories, even though multifamily remained the majority.
72 West was almost entirely multifamily
Tract 106.12 recorded 298 multifamily units and one single-family unit. Several active apartment projects appear in the City's year-end construction table for that tract, but those project rows contain cumulative built counts. They cannot be summed and relabeled as 2025 certificates without project-level issue dates.
Fifteen tracts accounted for 83.2 percent of completions
The top five tell nearly half the story. Ten more tracts each added at least 100 units, bringing the 15-tract total to 4,006 of 4,813 citywide certificates.
Next tier
Ten more tracts added at least 100 units
Area labels are omitted where the Development Review's top-five table did not provide one. Use the City's map for exact boundaries.
| 2020 Census tract | Detached / townhome | Multifamily | Total new units |
|---|---|---|---|
| 106.26Partial / combined City tract | 0 | 287 | 287 |
| 112.01Partial / combined City tract | 35 | 207 | 242 |
| 21 | 0 | 200 | 200 |
| 110.27Partial / combined City tract | 0 | 192 | 192 |
| 28.03Partial / combined City tract | 0 | 142 | 142 |
| 106.25Partial / combined City tract | 3 | 130 | 133 |
| 208.03Partial / combined City tract | 131 | 0 | 131 |
| 212.03Partial / combined City tract | 40 | 90 | 130 |
| 106.27Partial / combined City tract | 20 | 103 | 123 |
| 14.01Partial City tract | 8 | 111 | 119 |
4,813 completions produced 4,767 net new housing units
Certificates of occupancy measure new units added. The City's housing-stock table separately records demolished or moved units. After those removals, Huntsville added a net 4,767 housing units during 2025 and reached an estimated 123,781 units at year-end.
The 46-unit difference is small relative to the construction total, but it illustrates why gross delivery and net stock change should remain distinct. In an individual tract, demolitions can also cause the net figure to differ from the number of new certificates.
The 2025 total was high, but below 2024
The City issued certificates for 6,404 residential units in 2024, including 5,211 multifamily units. In 2025, the citywide total fell to 4,813 and apartment certificates fell to 3,737, a 28 percent decline. Detached single-family certificates also declined 9.8 percent.
This is better described as a still-large completion wave rotating down from an exceptional prior year—not as housing production disappearing.
The 2026 feed shows a different mix so far
Huntsville's public permit-statistics feed was last updated July 11, 2026 when reviewed. It showed 856 residential certificates year to date: 537 detached single-family units, 58 townhomes, four duplex units, and 257 multifamily apartment units.
Those figures are a partial-year operational feed and should not be projected mechanically into a final 2026 total. They do show that multifamily certificates represent a much smaller share of year-to-date delivery than they did in the full 2025 report.
How this data belongs in future reporting
Market reports
Keep certificates separate from active listings, pending sales, closings, and months of supply. A new rental building is part of housing supply but is not an MLS for-sale listing.
Development stories
Use certificates to advance a project from permitted or under construction to delivered. Do not assume full lease-up, sale, or resident occupancy from the certificate date.
Neighborhood notes
Use tract data as a reporting signal, then verify exact project addresses and boundaries. Do not convert a Census tract into a school zone, subdivision boundary, or subjective neighborhood ranking.
Trend comparisons
Compare the same measure and time period. Annual City certificates can be compared with prior annual certificates; a July year-to-date feed should be compared with a matching prior-year period only if the source provides it consistently.
Primary sources
- City of Huntsville, 2025 Huntsville Development Review, Tables R-3, R-4, and PH-2.
- City of Huntsville, 2025 Development Review summary, January 27, 2026.
- City of Huntsville, Development Review archive.
- City of Huntsville, current building permit and certificate statistics.
- City of Huntsville, public permit-statistics data feed, last updated July 11, 2026 when reviewed.
- City of Huntsville, 2024 Development Review summary, January 29, 2025.
- City of Huntsville, GIS maps and Development Review application.
- U.S. Census Bureau, geographic terms and Census tracts.
This report explains aggregate public construction records. It is not current listing, leasing, vacancy, valuation, or investment data. Generated imagery is an editorial illustration.