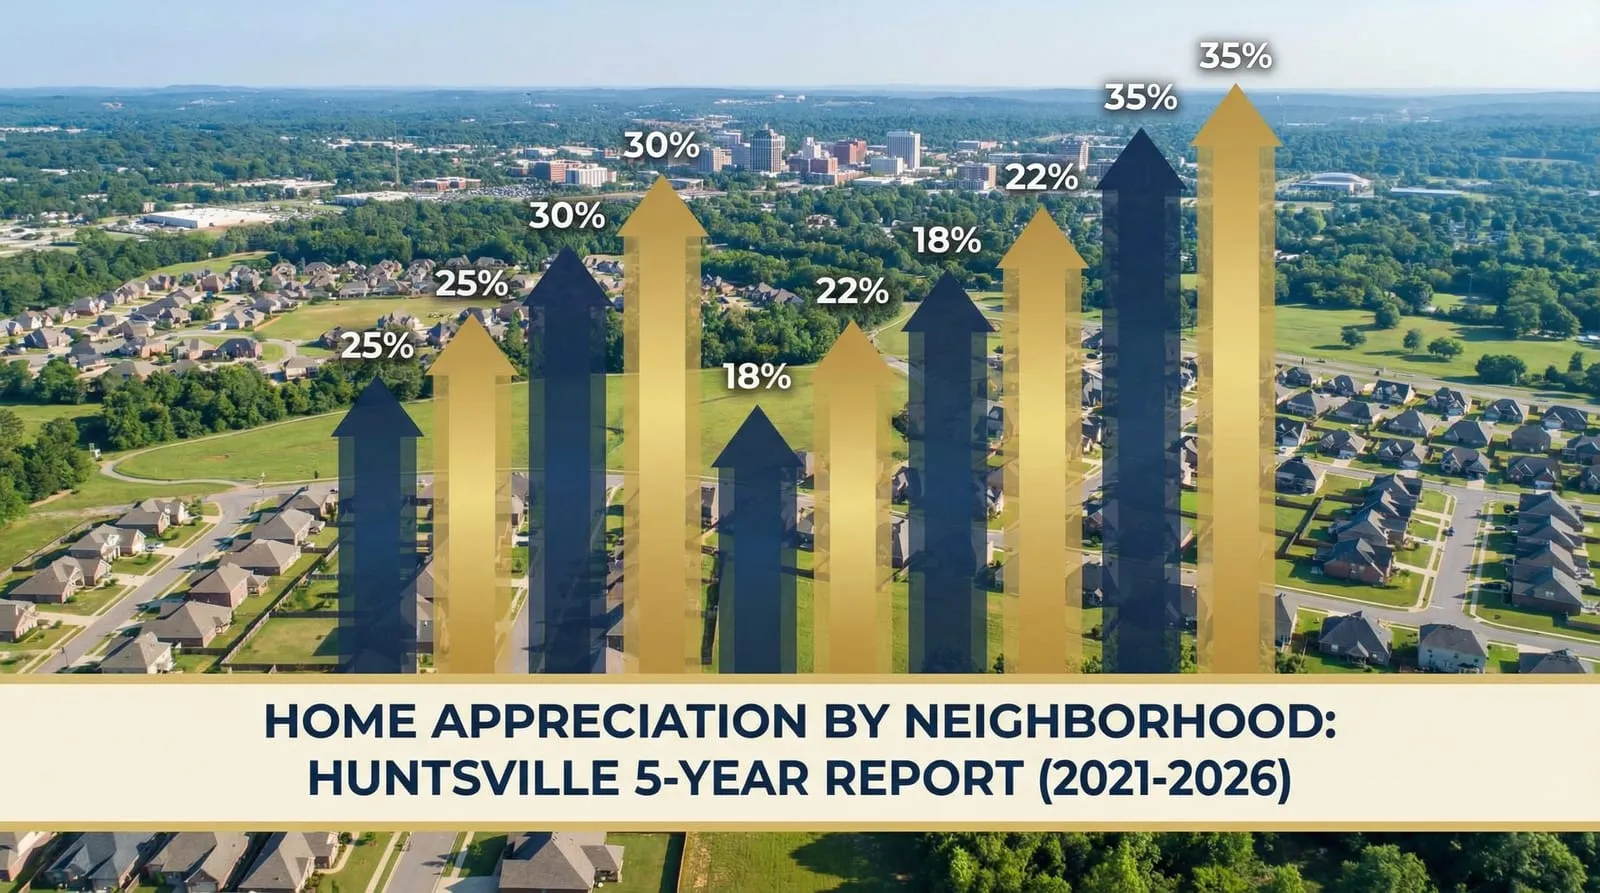

Home Appreciation by Neighborhood: Huntsville 5-Year Report (2021–2026)
Written by Jon Smith, local Huntsville Realtor — April 2026
The single biggest misconception about Huntsville home appreciation is that "Huntsville" is one market with one appreciation number. It isn't. Over the past 5 years, different Huntsville neighborhoods and sub-markets have appreciated at very different rates — some doubled, some moved 30%, some moved less than 20%. Knowing the actual neighborhood-by-neighborhood numbers is essential for making good decisions about buying, selling, refinancing, or tapping equity.
This is the local-Realtor 5-year appreciation report for Huntsville and Madison County, neighborhood by neighborhood, with the underlying drivers and what they mean for 2026 decisions. The numbers are pulled from HAAR MLS closed-sale data and supplemented with on-the-ground knowledge of which neighborhoods are actually changing in ways the data lags.
Get a free local-Realtor home value report based on real comps.
The headline numbers
Huntsville metro median home price, year over year, 2021 → 2026:
- Spring 2021: ~$245,000 metro median
- Spring 2022: ~$295,000 (+20% YoY — peak frenzy)
- Spring 2023: ~$330,000 (+12% YoY)
- Spring 2024: ~$345,000 (+4.5% YoY)
- Spring 2025: ~$352,000 (+2% YoY)
- Spring 2026: ~$358,000 (+1.7% YoY)
Total 5-year appreciation, metro median: ~46%. That's the headline number people see.
But the metro median hides enormous variation. The actual ranges:
- Hottest sub-markets (Madison Bob Jones zone, in-town walkable, parts of Hampton Cove sub-$500K): 60–75% appreciation
- Average sub-markets (most of Huntsville's established neighborhoods): 40–55% appreciation
- Soft sub-markets (parts of new construction, certain higher price bands, older outlying areas): 25–40% appreciation
If you assumed your home appreciated at the metro median, you might be off by $30,000–$80,000 in either direction depending on where you actually own.
Neighborhood-by-neighborhood breakdown
Madison City — Bob Jones zone (the appreciation leader)
- 5-year appreciation: ~70%
- Why: Top-rated school zone in the metro, limited resale inventory, sustained Redstone/Cummings Research Park employment growth, rapid build-out of supporting amenities. Demand from in-state and out-of-state relocations consistently outpaces supply.
- 2026 dynamics: Still the tightest sub-market in the metro. Spring 2026 days on market in the high-teens. Multiple offers still common on well-prepared homes sub-$500K.
- Outlook: Likely continued mild appreciation through 2026. The growth ceiling is set by what relocation buyers can finance at current rates.
Madison City — James Clemens zone
- 5-year appreciation: ~58%
- Why: Strong schools (just below Bob Jones in perceived ranking), newer construction inventory, easier supply growth than the Bob Jones zone (more developable land).
- 2026 dynamics: Healthy but more inventory available than Bob Jones. Days on market 25–35.
- Outlook: Stable. New construction in the area continues to expand supply, which moderates appreciation but keeps the sub-market liquid.
Hampton Cove — sub-$500K
- 5-year appreciation: ~62%
- Why: Sustained demand from Redstone Arsenal commuters who want a slightly slower lifestyle than Madison/Five Points, top-rated Hampton Cove Elementary, low crime, mature established subdivisions.
- 2026 dynamics: Tight under $500K, much softer over $600K. Days on market sub-30 for the lower band.
- Outlook: The sub-$500K end stays tight; the $600K+ end has more competition from new construction in surrounding areas.
Hampton Cove — $600K and above
- 5-year appreciation: ~38%
- Why: Luxury price band has been more sensitive to mortgage rate increases. Pool of buyers shrunk significantly when rates moved from 3% to 6.5%+. Supply of new construction in the wider Huntsville luxury market grew.
- 2026 dynamics: Days on market 75–120+. Price reductions common. Negotiations significant.
- Outlook: Continued softness until rate environment improves or supply tightens.
Five Points / Old Town / in-town walkable
- 5-year appreciation: ~55%
- Why: Lifestyle premium from walkability, restaurant scene growth, downtown employment growth, strong owner pride and renovation activity. Limited inventory because supply is fixed (no new neighborhoods being built).
- 2026 dynamics: Tight in the $400K–$650K range; softer above $750K. Days on market 30–45 for the core band.
- Outlook: Continued mild appreciation. The fundamentals (limited supply, growing employment, lifestyle premium) remain intact.
Blossomwood / Twickenham
- 5-year appreciation: ~50%
- Why: Established premium neighborhoods with limited inventory. Strong appreciation in mid-band homes, more variable at the high end.
- 2026 dynamics: Days on market 40–60. Quality of specific home matters enormously here — well-renovated homes outperform; deferred-maintenance homes get steep negotiations.
- Outlook: Stable. The neighborhoods are mature and the dynamics are more about individual home quality than sub-market direction.
Jones Valley
- 5-year appreciation: ~45%
- Why: Solid established Huntsville neighborhood with diverse price bands. Closer to downtown employment than Hampton Cove. Less premium than Five Points.
- 2026 dynamics: Days on market 35–55. Functional and active.
- Outlook: Stable; tracks the metro average.
Owens Cross Roads (OCR)
- 5-year appreciation: ~52%
- Why: Spillover demand from Hampton Cove buyers who couldn't find inventory in Hampton Cove proper. New subdivisions delivered substantial supply but demand absorbed it.
- 2026 dynamics: Days on market 40–60. New construction competing with resale.
- Outlook: Mild appreciation continues. New construction pipeline is the swing variable.
Athens (broader Madison County north)
- 5-year appreciation: ~58%
- Why: Lower price point starting in 2021, significant Mazda Toyota Manufacturing employment driver, new subdivisions delivered, school zone improvements.
- 2026 dynamics: Active and diverse. Days on market 30–50 depending on price band.
- Outlook: Continued growth driven by employment and price affordability relative to Madison/Hampton Cove.
Big Cove / Brownsboro
- 5-year appreciation: ~48%
- Why: Established rural-suburban character, longer commutes, school zone variability.
- 2026 dynamics: Days on market 50–80. Variable.
- Outlook: Tracks lower than the metro for buyers who prioritize commute and amenities.
NW Huntsville / older outlying neighborhoods
- 5-year appreciation: ~32%
- Why: Less new investment, older housing stock, more variable school zones, lower base price point provided proportionally less appreciation.
- 2026 dynamics: Functional but slower. Days on market 60–100+.
- Outlook: Stable but unlikely to lead the metro.
A real client story
Late 2025 a couple in their early 50s called me. They'd bought a Madison Bob Jones zone home in 2018 for $268,000. They'd refinanced in 2020 to a 3.50% rate. They asked: "What's our home worth now?"
The Zillow Zestimate said $385,000. They wanted to confirm or correct that number before deciding whether to sell.
I pulled real comps. The Bob Jones zone sub-market had appreciated ~70% over their 7-year hold. Their specific home (2,100 sq ft single-story, fully updated, mature corner lot) was actually toward the top of its sub-segment. Real value range: $455,000 to $475,000.
That's a $70,000–$90,000 understatement vs. the Zestimate. They had $190,000+ of equity they didn't know about.
We did NOT list the home — they decided to keep it given the great rate and the strong sub-market dynamics. But knowing the real value let them tap a $100K HELOC for a property investment they'd been considering, with full understanding of their actual equity position.
His take after we ran the numbers: "We literally would have left the equity on the table if we'd taken any decision based on the Zestimate. The Madison Bob Jones zone has been moving on a different track than the Huntsville average for 5 years and the algorithms haven't caught up."
Original Jon insight: the appreciation gap that's quietly reshaping Huntsville
Here's something I track that I don't see anyone else publishing: the gap between the hottest and coldest Huntsville sub-markets has WIDENED over the past 5 years, not narrowed. And that gap has implications most homeowners aren't thinking about.
In 2021, the difference between the hottest sub-market (Madison Bob Jones) and the coldest (NW outlying) was about 22 percentage points of cumulative appreciation. Today, that gap has grown to roughly 38 percentage points. Two homes that were both worth $260,000 in spring 2021:
- The Bob Jones zone home: now ~$442,000
- The NW outlying home: now ~$343,000
The gap on identical starting prices is now $99,000. It was about $57,000 in 2021. The wedge has widened.
Why this matters:
-
Refinancing and equity decisions need to be sub-market-specific. A homeowner using metro-average appreciation assumptions to estimate their equity position will be wrong, sometimes by tens of thousands of dollars.
-
Move-up math has shifted dramatically. A homeowner in a strong sub-market who wants to move up has more equity to deploy than they realize. A homeowner in a weak sub-market has less. Both should know exactly where they actually stand before making a move.
-
The "buy in any Huntsville neighborhood and you'll do fine" advice from 2021 is no longer accurate. Sub-market selection has become a more important determinant of return than purchase timing.
-
The widening gap is being driven by fundamentals (school zones, employment proximity, amenity quality, supply constraints), not by speculation. That means it's likely to persist, not mean-revert.
-
Sellers in strong sub-markets should know they're in a strong sub-market and price accordingly. Sellers in soft sub-markets need to recognize that the metro-wide narrative doesn't apply to them and price more carefully.
The data behind the gap is in HAAR MLS closed sales — anyone with MLS access can see it if they know where to look. But the metro-level news coverage almost never breaks it down by sub-market. The sub-market-level reality is meaningfully different from the metro-level headline.
I have walked Huntsville homeowners through their actual sub-market appreciation versus the metro average dozens of times in the past 18 months. The conversations always go the same way: surprise, recalculation of net worth, recalculation of options, better decisions. You can't make good decisions about your home if you're using the wrong appreciation number.
Frequently Asked Questions
Which Huntsville neighborhood has appreciated the most? The Madison City Bob Jones school zone, followed by sub-$500K Hampton Cove and the in-town walkable areas (Five Points, downtown, Old Town).
Which Huntsville neighborhoods have appreciated the least? Older NW Huntsville areas, certain higher-priced ($700K+) sub-markets where rate sensitivity hit hardest, and areas with significant new construction supply growth.
Is Madison City worth the premium? For families specifically targeting Bob Jones or James Clemens schools, generally yes — the appreciation track record supports it. For buyers without a school zone constraint, the premium may not be necessary.
Will Huntsville keep appreciating in 2026 and beyond? Mild appreciation is the most likely scenario for the metro average, with continued sub-market variation. Don't expect 2021-style gains.
How accurate are these appreciation numbers? They're based on HAAR MLS closed sales aggregated at the sub-market level. Individual home appreciation can vary significantly from the sub-market average based on condition, lot, updates, and specific micro-location.
Should I buy in a soft sub-market for lower prices? Maybe. Soft sub-markets have lower entry prices but slower appreciation. Strong sub-markets have higher entry prices but more durable value. The right choice depends on your hold period, your finance situation, and your priorities.
How can I find my home's actual current value? A real CMA from a local Realtor is the most accurate option, free, and based on actual comparable sales in your specific sub-market.
Next step
The right value for your Huntsville home depends on your specific neighborhood's appreciation trajectory, not on the metro average. Get a real number before making any decision based on equity.
Real comps and real local insight. Free, no obligation.
Related reading:
- How Home Valuations Actually Work in Huntsville (Beyond Zillow)
- Why Your Zillow Zestimate Is Wrong in Huntsville
- Should I Sell My Huntsville Home Now or Wait?
- Is It Worth Selling Your Huntsville Home and Downsizing?
- How to Tap Home Equity in Huntsville Without Selling
Jon Smith is a licensed Alabama Realtor serving Huntsville, Madison, Hampton Cove, Owens Cross Roads, and the broader Madison County area. Appreciation figures are pulled from HAAR MLS data and supplemented with local market knowledge. This guide reflects April 2026 conditions.